


11 Stocks, 15 Pitches, 2.5 Years Later
The Blog: What Held Up, What Didn't and What Might Still Be Worth Buying Today

When I published my first post back in February 2023, I set out to share thoughtful, occasionally contrarian investment ideas and to learn in public. Two and a half years later, I thought it was time to look back. Not to pat myself on the back (or beat myself up), but to ask a few honest questions: Were any of these calls genuinely helpful? Did the underlying ideas hold up? And are there still opportunities worth exploring today?
In the table below, I’ve compiled every article where I expressed a clear interest in a stock or instrument, along with its performance since publication. I’ve converted all prices to USD for consistency, not because I invest in dollars, but because that’s the only currency with full data coverage via TIKR. Keep in mind, the dollar has weakened against currencies like the Pound, Zloty, and Euro, which flatters some of the returns1. I’m not a currency trader and never made explicit FX bets, so take that distortion for what it is. Furthermore I added “Event Adjusted Price”, this is todays price adjusted for any dividends received or buybacks you should of participated in2.

This isn’t just a scorecard. It’s an exercise in reflection, and hopefully, a chance to unearth a few ideas that might still deserve a place on your watchlist, or at least teach us something worth remembering.
What follows is a rundown of every stock pitch I’ve made on the blog. For each one, I’ll briefly recap the original idea, give a short update on how the business has performed since, and offer a quick personal take on what I got right, what I missed.
Warning: The following article is for informational purposes only and should not be considered as investment advice. The author is not a registered financial advisor and does not provide investment recommendations. Any investment decisions you make should be based on your own research and analysis.
Additionally, please be aware that the author may have a financial interest in the securities discussed in this article. The author reserves the right to buy or sell any security mentioned in this article at any time, without prior notice. Therefore, the information presented in this article should not be considered as a solicitation to buy or sell any security. Please consult with a registered financial advisor before making any investment decisions.
Prelude
Before this blog existed, I entered a student stock-picking competition hosted by Edwin Dorsey. I didn’t win, but I learned that writing about investments sharpens thinking and makes me a better investor. That realization was the foundation for this blog. So, let’s revisit the first stock I wrote about on this platform.
Monnari Trade S.A.

Pitch Summary
Monnari Trade is a small Polish fashion retailer. At the time of my pitch, it traded at a 54% discount to book value and a P/E of 4–5, solidly profitable and deeply undervalued. It was (and still is) a classic net-net, offering asset-based downside protection with potential upside from either capital returns or a rerating on earnings. In short, an attractive risk/reward profile.
I published the article on February 26 at a share price of 4.70 PLN. As of today, the stock trades at 4.90 PLN, not exactly a home run. But the Polish zloty has appreciated nearly 20% against the U.S. dollar since then, making the dollar-denominated return much better than in local currency.


The stock did climb meaningfully after the article, before retracing back to the original price. For transparency, I no longer hold a position in Monnari. I exited around current levels, not at the top, in order to reallocate to what I considered more compelling opportunities.
Business performance.

Operating income has been mediocre since I first wrote about Monnari. Still, with the stock roughly flat and the company generating some earnings over that period, book value has grown—and the valuation gap has widened.
Although earnings have been weaker than I originally expected, Monnari has continued to generate solid profits—especially relative to its valuation at the time of the first article.
2023 net income: 18.3 million PLN
2024 net income: 21.5 million PLN
Q1 2025 net income: 0.8 million PLN
That totals 40.6 million PLN, or roughly one-third of the 120 million PLN market cap when I first pitched the stock.
As of year-end 2024, equity stood at 305 million PLN. With a market cap of just 123 million PLN today, the stock trades at about 40% of book. The company holds 88 million PLN in investment real estate and 76 million PLN in cash, meaning a large portion of book value is relatively liquid.
That said, I’m not comfortable with inventory levels. At the end of 2024, inventory reached an all-time high of 125 million PLN, raising questions about operational efficiency and working capital discipline.

On the operating front, Monnari has made little progress. It hasn’t completed any meaningful transactions, nor has it improved profitability. Capital allocation has also disappointed: most excess capital remains parked in cash and bonds, while the majority owner has directed some funds into additional real estate—not exactly a compelling use of shareholder capital.
Although earnings have been weaker than I originally expected, Monnari has continued to generate solid profits—especially relative to its valuation at the time of the first article.
2023 net income: 18.3 million PLN
2024 net income: 21.5 million PLN
Q1 2025 net income: 0.8 million PLN
Total: 40.6 million PLN, or roughly one-third of the 120 million PLN market cap when I first pitched the stock.
Pitch Evaluation
I think this pitch still hold, but earnings have been weaker than I hoped and the CEO made clear he only intents to distribute any cash if margin of the core business are above 10%. This combined with other option available to me made me sell. I still think Monnari is a fine stock to hold in a basket of net-nets. But not in the style of concentrated investing I like.
Eurosnack S.A.

Pitch summary
My pitch on Eurosnack focused on its apparent undervaluation, given the company’s exceptional growth under current management, around 40% annually, and the potential for gross margin expansion. That margin upside, I argued, would drive strong bottom-line growth and bring the forward P/E down to around 6–8.
At publication, the stock traded at 1.95 PLN (USD 0.44); today, it's 2.55 PLN (USD 0.68). Some of that return reflects zloty strength, but dividends also contributed meaningfully: Eurosnack has paid out 0.17 PLN per share since the article.
The stock appreciated rapidly in the months after publication and has since plateaued. I continue to hold Eurosnack. At a fully diluted market cap of ~100 million PLN and 2024 earnings of 13 million PLN, the stock trades at a P/E of 8. That remains cheap for a capital-efficient, growing business.
Business performance

Revenue and gross profit have continued to rise, driving strong operating leverage. Net income came in at 10.4 million PLN in 2023 and 13 million PLN in 2024. Growth has slowed more recently, Eurosnack appears to have hit capacity limits at its existing facilities.
In response, the company has begun building a new production facility. The project looks attractive: it’s supported by the Polish government, which is providing discounted land and tax incentives. Execution will be key, but the decision aligns with Eurosnack’s long-term growth strategy.
Relative to its market cap at the time of my pitch (~80 million PLN), the company has delivered well:
2023 net income: 10.4 million PLN
2024 net income: 12 million PLN
Q1 2025 net income: 2 million PLN
Total: 25 million PLN, or ~30% of the original market cap.
In addition, Eurosnack paid out nearly 7 million PLN in dividends over 2023–2024 roughly 9% of the starting market cap. That’s a solid return from a business still in growth mode.
Pitch Evaluation
This pitch has largely played out as expected. The most important driver, margin expansion, materialized, with earnings surpassing my base case projections. Margins are slightly ahead of expectations, even as revenue lags slightly behind.

Growth has cooled, and costs have risen as the company ramps up its new facility. The key question now is whether this expansion reaccelerates growth. That said, the core thesis, strong earnings growth from margin leverage and an undervalued starting point, proved accurate.
A clear success.
Kistos Holdings
Kistos is a unique case: I wrote two articles on the company, timed almost perfectly in opposition to each other. The first, Andrew Austin: The Next Outsider, was poorly timed, with the stock dropping nearly 70% at one point. The second article, written near the lows, caught the exact bottom. Since then, the stock has rebounded 75%, though it still trades well below the level of the original write-up.

Pitch Summary
My first piece came as Kistos hit a 52-week low, following a decline in gas prices after a mild summer. Rather than focus on asset-level valuation or commodity forecasts, I centered the pitch on Chairman Andrew Austin’s capital allocation track record—drawing comparisons to the CEOs profiled in The Outsiders by William Thorndike. I framed Kistos as a bet on leadership, not natural gas prices. That decision ultimately underestimated the complexity of the asset base and the macro risks.


Pitch Summary
By the time of the second article, the stock had fallen ~60% from its earlier level—pressured by further gas price declines, operational setbacks, and a going concern note in the audited financials. This time, I approached the situation differently: the analysis focused on upcoming cash inflows, covenant risk, and event-driven catalysts.
I argued that despite surface-level distress, Kistos had enough visible cash flow to survive and potentially emerge stronger. The market was pricing in insolvency; I believed the worst was already behind it. That call has, so far, proved well-timed.
Kistos’ share price like many other UK O&G business, kept falling post my first article for a long time. Hitting the bottom right around the time of my second article.


Business performance
Kistos is a complicated company to evaluate, and I won’t try to fully re-explain it here, my second article does a better job of unpacking the moving parts. But in basic terms: reported earnings have been weak.
2023 net income: –26 million
2024 net income: –50 million
Total: –76 million
Of course, oil and gas accounting leaves plenty of room for noise, non-cash D&A, impairments, and write-downs often distort the income statement. Cash flow tells a more useful story:
2023 FCF (Op cash – Capex): 220m – 130m = 90m
2024 FCF: 103m – 144m = –41m
Total: 49m USD (~36m GBP)
That’s about 15% of Kistos’ 280 million GBP market cap at the time of the first article, decent, considering the environment.
Pitch Evaluation
The first Kistos pitch was a clear miss. Operational issues and falling gas prices hurt, but I also underestimated the complexity of the company’s assets and overemphasized the management angle without sufficient depth on the underlying business.
The second article, however, was far more robust, focused, detailed, and timed when sentiment was at its lowest. It correctly identified the key drivers of survival and recovery. That thesis is playing out as expected, and while the stock hasn’t fully recovered, the risk/reward at the bottom was compelling.
A bad start, but a strong rebound.
The article is way to long for most email providers, so consider reading the rest of the article in the app or on the Substack website.

Card Factory
Card Factory is one of the most frequently covered stocks on this blog, with two write-ups and a podcast appearance on the Momentum Financial Youtube channel.

Pitch Summary
At the time of my initial article, Card Factory looked optically cheap, trading at ~7x earnings, with free cash flow historically matching or exceeding reported profits. That kind of valuation implied a broken business or dying retailer. But Card Factory had been named the UK’s #1 value-for-money retailer for seven straight years and had a solid track record of capital-efficient growth pre-COVID.

Pitch Summary
My second piece took a Greenblatt-style approach, framing Card Factory as a “magic formula” stock: low EV/EBIT, high returns on tangible capital. Importantly, the stock’s market cap hadn’t moved, but debt repayment had materially reduced its enterprise value. On an EV basis, the stock was meaningfully cheaper than at any point in its history.
Despite the fundamentals, the market has been reluctant to agree on the company’s quality. The stock has oscillated in a narrow band—forming a perfect trading wave between 90p and 110p. Anyone timing that range would’ve made a fortune; a long-term holder like me? Less so.

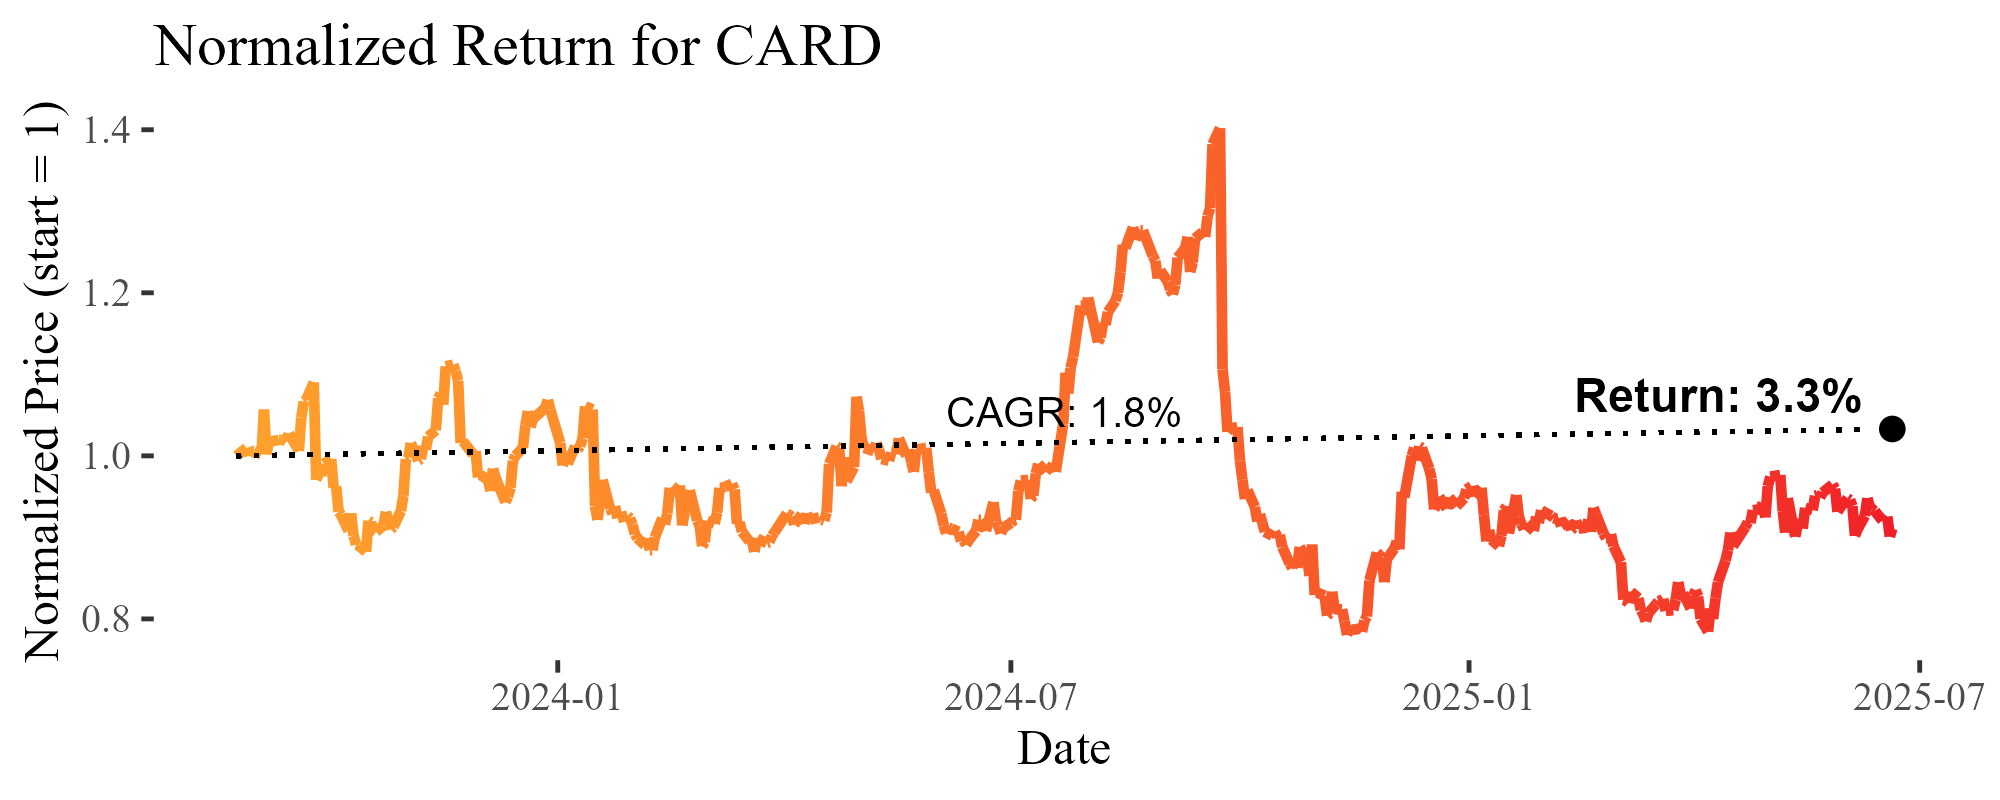
A major factor was Tellios Capital, the largest shareholder, consistently selling into any rally around 110p. That dynamic finally broke when Tellios sold its remaining stake to private equity vehicles tied to Australian retail billionaire Brett Blundy. His reputation sparked optimism—especially as he was expected to take board seats. The stock jumped to 130p on the news.
Then came the UK’s Autumn Budget.
Labour’s new policies were brutal for low-margin retailers: a lower national insurance threshold for part-timers, a double-digit minimum wage hike for younger workers, and no offsetting relief on business rates. Card Factory—like other UK high-street chains—was left footing the bill for Labour’s fiscal plans.
To management’s credit, they successfully mitigated most of 2024’s cost pressures and remain confident about 2025. But the market is skeptical.
Business performance

Since my initial pitch, Card Factory has generated £97 million in earnings—about one-third of its then-£350 million market cap—and paid some dividends along the way. The stock, however, has barely moved. That’s not due to business performance, which has held up well relative to UK retail peers. It’s more a function of macro pressure and poor investor communication.
Management’s growth plan has also surprised on the capital intensity front. Recent partnerships are less working-capital-friendly than the company’s own model. The deals appear attractively priced—even versus buying back stock—but management hasn’t communicated them well. As a result, the market assumes they squandered capital.
The core business remains resilient. Execution has been strong. But market trust is thin.
Pitch evaluation
I’ve adjusted my view. When I first pitched Card Factory, I thought it was one of the cheapest capital-efficient growth stocks I’d ever seen. I still think it’s above average—just less exceptional than I initially believed.
That said, when you buy cheap enough, you don’t have to be right on everything. I still hold Card, and at current prices, I expect to continue doing so. The business is sound. The valuation remains attractive. But the story is no longer as clean—or as misunderstood—as it once was.
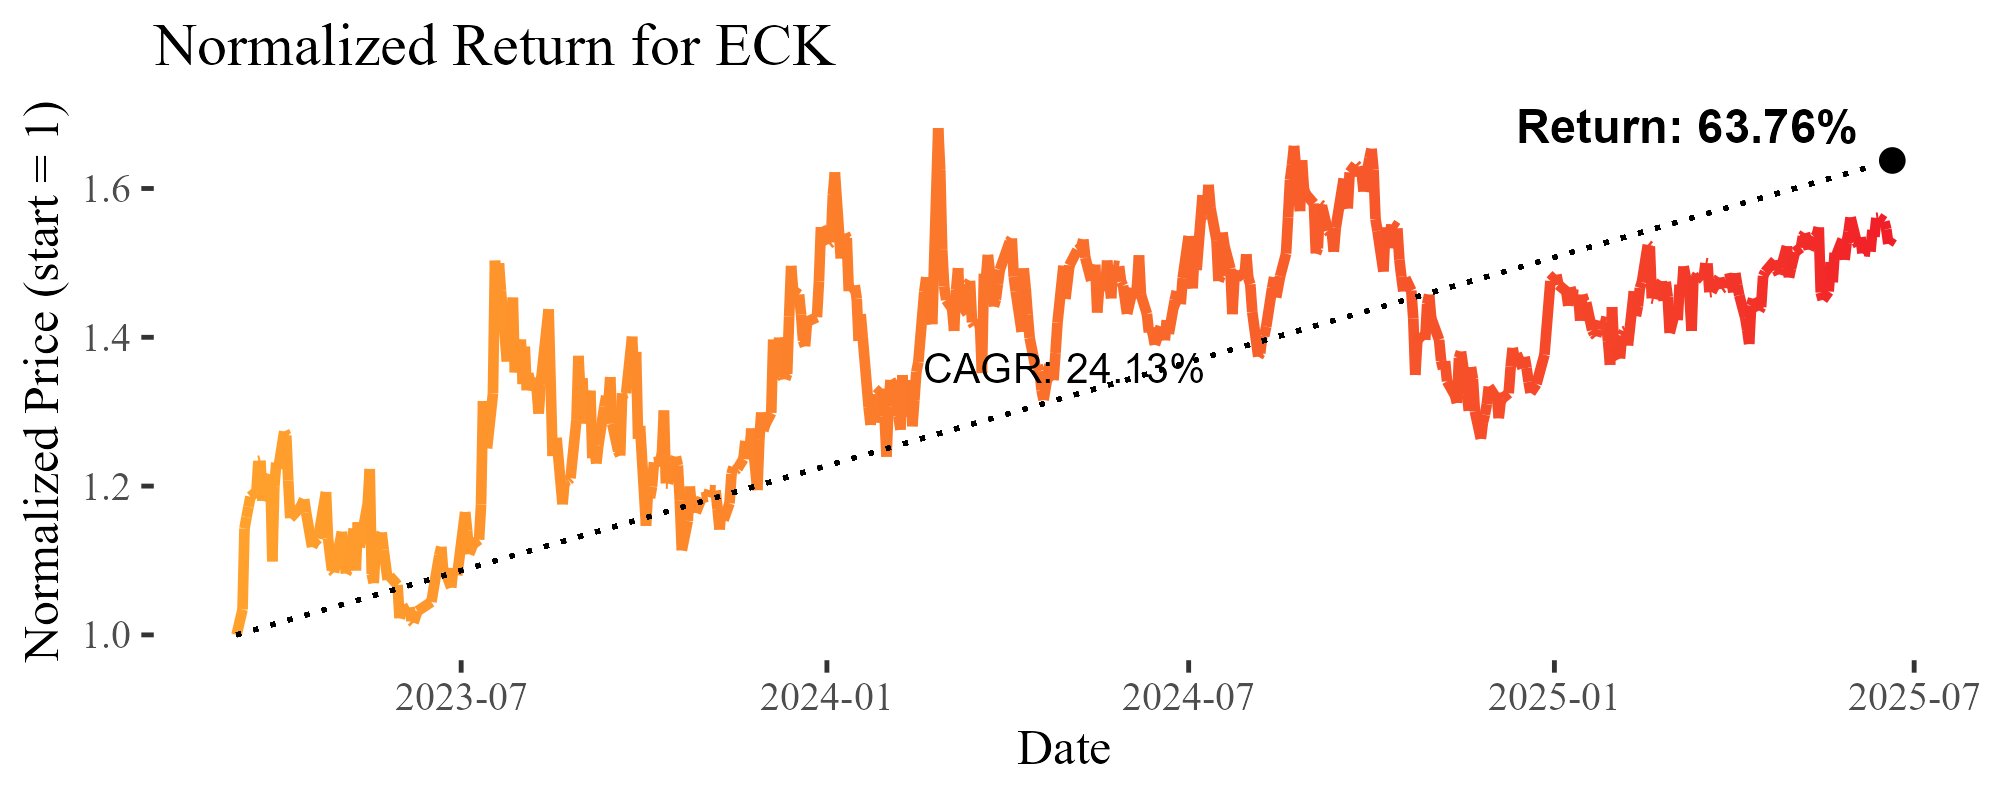
Interlife General Insurance

Pitch summary
Interlife has done reasonably well in share price terms since my write-up, though the underlying business hasn't fully lived up to the expectations I laid out. At the time, I estimated it traded at around 3x forward EBIT, a compelling multiple, but that turned out a bit too ambitious, as the underwriting environment has been tougher than expected. Inflation has proven sticky, and much of the Greek insurance industry has been slow to adapt.
Despite this, Interlife has continued to grow steadily, with net premiums increasing from €80M in 2022 to €98M in 2024. Rising interest rates post-COVID have helped insurers across the board, allowing Interlife to generate solid returns on its investment book. I briefly considered selling when underwriting results began to slip, but that felt like "selling the farm because it didn’t rain this year." The long-term underwriting culture still looks strong, and I remain comfortable holding the stock.

Business performance

Underwriting has clearly been under pressure. Interlife’s combined ratio has ticked up, and ROE has taken a hit. But strong investment income has offset some of that weakness. Overall earnings remain respectable for a company still trading near 0.7x book:
2023: €13.7M net income (10% ROE)
2024: €11.7M net income (8.7% ROE)
Total: €25.4M – or roughly 1/3 of the €75M market cap when I first covered it.
The stock hasn't re-rated significantly, but has delivered solid earnings relative to price.
To estimate normalized earnings, I use a similar framework as in my original piece:
Premiums × Underwriting Margin + Investment Portfolio × Expected Yield
Assuming €110M in 2025 premiums and €300M in investments, even conservative estimates still suggest a solid earnings baseline. With German 10Y yields still at ~2.5%, Interlife should achieve something slightly better than that on its book.

Pitch evaluation
I was probably a bit too optimistic in expecting both strong underwriting and a big tailwind from higher yields to play out simultaneously. Only one of those came through. Still, the thesis hasn’t fallen apart—cheap valuation has provided a cushion. This is another reminder that if you buy at the right price, you don’t need to be completely right to do fine.
Nova Ljubljanska Banka

I pitched NLB when it was trading at just 0.6x book value, highlighting how it was uniquely positioned to benefit from a higher interest rate environment due to its nearly zero-cost deposit base. Since then, the stock has rerated meaningfully, now trading closer to 0.9x book, and delivered massive shareholder returns.
The most striking number? If you bought NLB at the time of the article (when the market cap was ~€1.5B), you would have received €230M in dividends over 2024 alone. That’s a 15% yield off your original cost basis—paid out while retaining a 50% payout ratio.

Business performance

Performance has been outstanding. As I stated back then, NLB stood out as one of the banks best positioned to capitalize on rising interest rates. The ECB has started cutting, so NIM will likely compress, but even so, I’m confident NLB will earn solid returns over the cycle.
Here's what the company has earned since the pitch:
Q3 2023: €144M (quarter was closed, but not yet reported at the time of writing)
Q4 2023: €164M
FY 2024: €530M
Q1 2024: €126M
Total: €964M
That’s 64% of the market cap at the time of the pitch—absolutely exceptional.
Pitch evaluation
This pitch was a clear winner, but I have to give credit to David from The Mikrokap, who flagged this stock for me. If you're not following his work yet, you're missing out on some of the best small-cap research out there.

Today, NLB trades at €2.9B market cap, ~0.9x book, with trailing earnings of €130M per quarter. That implies full-year earnings of around €500M, meaning it trades at:
6–7.5x earnings (13%–17% yield)
Dividend yield: 6.5%–8.5% (with a 50% payout ratio)
Book value growth: ~6%–7%, from reinvesting the retained earnings at a ~15% ROE
All-in, that suggests a 12.5%–15.5% expected annual return even with no further rerating. And if you believe, like I do, that NLB deserves to trade closer to 1.4–1.6x book—more in line with other well-run Eastern European banks—then the return profile remains extremely attractive for what is, fundamentally, a very conservatively run institution.
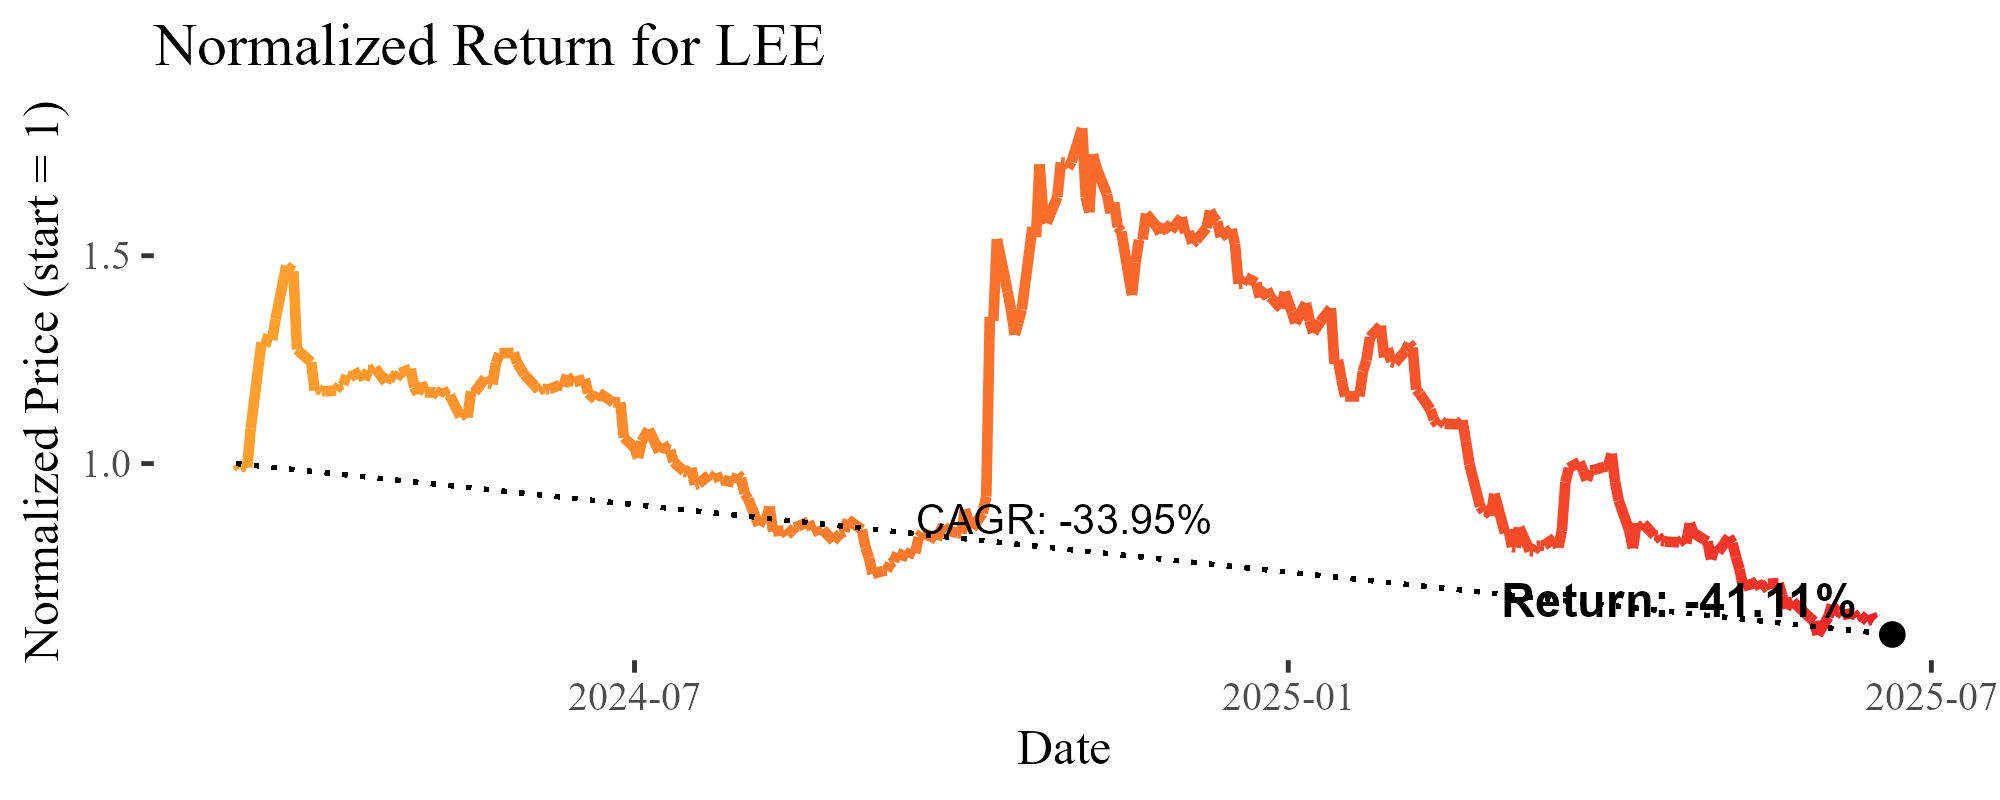
Lee Enterprises

Lee Enterprises was easily one of my most speculative positions. The chart tells the story: down 30%, up 80%, then down 30% again. My original thesis centered around the idea that free cash flow would inflect, something that still hasn’t happened—and realistically may never happen.
The speculative bump we got was due mostly to a potential acquirer buying large blocks on the open market. But as fundamentals and price completely disconnected, I sold the stock for a nice gain. That said, the stock is now significantly lower than where I pitched it, and since I don’t write articles on selling positions, I would consider this pitch a failure from a fundamental perspective & contribution to the blog.
Business performance
Lee’s core print business continues to decline, and the expected cash flow inflection has simply not materialized.
Management continues to push the digital transformation narrative, claiming revenue growth is just around the corner—“soon™”. But that timeline keeps getting pushed back another year, again and again. Even digital-only growth is now slowing down.

Previously, at least there was operating income to cover interest expense. Now, even that has disappeared, and the business is flying dangerously close to the sun in terms of leverage and cash burn.
Pitch Evaluation
This pitch is, frankly, a stinker.
While there was some speculative value that briefly played out—outside parties showing interest in Lee’s equity—that wasn’t the core of my pitch. The fundamentals I bet on, namely FCF generation and debt paydown, never showed up.
It’s a reminder that even a good speculative setup can’t substitute for actual operating leverage or clear business momentum. This one goes in the “miss” column.
XLMedia

XLMedia was my first proper special situation, and a clear mistake. My analysis of the remaining balance sheet and likely cash burn was lazy, which led me to overstate the amount of capital that could realistically be distributed to shareholders. I pitched the stock at around 12p. On January 12th, the company announced a buyback of 52% of the share capital at 11.5p. It was one of the strangest executed buybacks I’ve ever seen, and most participants had less than 50% of their tendered shares repurchased. On April 10th, the company announced a final buyback at 11p. Depending on how you participated, you ended up with a loss between 6% (if you split the tender across both buybacks) and 8.3% (if you only managed to tender at 11p).
In that sense, the loss was modest and resolved relatively quickly, but the thesis itself did not play out. This was a clear misstep for the blog but a valuable personal learning experience.

Business performance
XLM only published one set of financial results between my write-up and the final buyback. These results showed significantly lower liquid assets than I had estimated, primarily due to a higher-than-expected rate of cash burn. In the end, the total amount returned to shareholders came in lower than the 12p share price at the time of the pitch. My thesis hinged on those assets being distributable and protected, which turned out not to be the case.
Pitch evaluation
My pitch on XLMedia had multiple failings. I misunderstood key liabilities and incorrectly assumed they would be offloaded as part of the asset sale. I also underestimated the speed and scale of cash burn in the core business. Despite those errors, the loss was contained, and the situation played out quickly. Investors received a significant portion of their capital back within a month, and the rest came within about half a year. Although this was a losing position, the quick resolution limited the opportunity cost. Still, this was a clear miss in terms of analytical quality and precision. A loss, but not a disaster.
PRAX DCU’s

Pitch Summary
My pitch was quite straightforward: PRAX DCUs entitle holders to 17.5% of revenue from PRAX Upstream (formerly Hurricane Energy), paid out in semiannual installments through the end of 2026. Based on then-current production and oil prices, I estimated the remaining four installments could total around 3p, offering a very attractive IRR for holders who could acquire them around 1.7–1.8p. The instruments briefly traded up to 2.0p but mostly hovered near entry price.
This was a situation I couldn’t personally buy into, but it looked compelling enough to write up. Unfortunately, there’s no available price chart due to the nature of the instrument.
Business performance
We don’t have full visibility into PRAX Upstream’s performance, but we do know that in H2 2024, the company:
Sold 1,457,460 barrels of oil
Generated £84.44 million in revenue
Which translates into £14.78 million for the DCUs, or a dividend of £0.00742 per DCU
This was well above my expectations for the period, which is a promising early sign. While the cap on total payments is now slightly closer than I had projected, I didn’t think we’d hit the cap anyway—so not a major concern.
Importantly, the recent Total deal has added many more barrels to PRAX’s upstream portfolio, and higher oil prices further improve the payout outlook. The setup still looks good for meaningful gains, assuming PRAX continues to operate steadily.
Pitch Evaluation
It’s still too early to fully judge this pitch. If you bought DCUs after the write-up, you haven’t yet received a dividend—but the one payout made so far came in materially above my expectations. That’s encouraging, and suggests my projections were conservative rather than over-optimistic.
At current oil prices and with added volume from the Total deal, PRAX DCUs still appear to offer a highly attractive risk-reward for investors able to acquire them. This idea is still playing out, but so far, it looks solid.
Otto Energy

Pitch Summary
Otto Energy was, and to some extent still is, a modern-day Delta Duck Club. At the time of my write-up, Otto was a cash-rich oil and gas producer trading below net cash, about to distribute most of its market cap in cash to shareholders. It was trading at 0.009 AUD (43m AUD market cap) and had announced plans to distribute 0.008 AUD per share in cash, largely tax-free.
After that distribution, Otto was expected to retain ~16m AUD in net cash versus an implied post-distribution market cap of just 3m AUD. On top of that, the company was still producing and, based on my conservative assumptions, capable of generating another 6m AUD in annual free cash flow.
The setup played out better and faster than expected. The 0.008 AUD distribution was completed just two months later, and though not entirely tax-free, it still represented a meaningful return of capital. The stock now trades at 0.004 AUD, giving investors a total value of 0.012 AUD — or a 33% return in just a couple of months.

Business performance
Otto hasn’t reported any operational updates since the write-up, so there’s little new to analyze on that front. However, the key business milestone — the return of capital — was achieved, which was central to the thesis.
The company did receive a tax ruling from the Australian Tax Office (ATO), though not all of the distribution qualified as tax-free:
0.00657 AUD per share was treated as a tax-free capital return
0.00143 AUD was treated as a taxable dividend
This minor tax wrinkle slightly affects the value of future distributions, which will likely follow a similar split between taxable and non-taxable treatment. That means we should modestly discount the value of any future returns.
Despite this, Otto remains cheap. It still holds approximately 16m AUD in cash versus a 20m AUD market cap, and continues to produce — with 5–6 years of remaining production and an estimated 6m AUD in FCF for 2024 based on my assumptions.
Pitch Evaluation
The Otto pitch has so far been more successful than expected. The capital return happened faster than anticipated, unlocking value quickly. Buyers at 0.009 AUD received ~90% of their capital back within weeks, and the remaining equity stub has trades at a premium to what you paid for it — while still appearing undervalued based on the company’s remaining cash and production runway.
It’s rare to see a situation de-risk this quickly and cleanly. This was a solid special situation that delivered a strong IRR.
I want to once again thank @lookdownnotup on Twitter/X for introducing me to this idea.

The Final Verdict
Below is an updated table of all my write-ups, now with an added column indicating whether I consider each pitch a success, mistake, or simply mid.

Here’s the breakdown:
3 mistakes
4 mid
5 successes
The XLM Media pitch, for example, ended with limited downside, but my analysis of the balance sheet was just wrong — lazy even. The cash burn was higher than expected, and the liabilities that remained on the books were ones I had wrongly assumed would be offloaded. That kind of basic misread makes it a clear miss, even if the damage was contained.
Lee Enterprises was similarly flawed. Yes, I warned readers to size small, and yes, there was speculative value that briefly played out. But ultimately, my central idea — that free cash flow would inflect — never materialized. Instead, the company kept skimming dangerously close to insolvency while delaying the growth narrative by “just one more year” every time. Not good enough.
The first Kistos article also deserves its place in the "mistake" column. I could try blaming gas prices or timing, but that would be disingenuous. The truth is, I misjudged the setup, full stop
Then we have the “mid” cases, Card Factory and Monnari, which land in the grey zone. These weren’t bad ideas. Both businesses have posted decent to even strong earnings. But neither stock has rerated meaningfully, largely due to management behavior. That’s on me — I underestimated the role that stewardship plays in unlocking value. Still, you wouldn’t have lost money holding either stock, and from a capital preservation point of view, they’ve been fine. From an opportunity cost perspective, less so.
The remaining pitches, I’m happy to say, fall squarely into the “success” camp. Most were just too cheap to ignore, and even when I was overly optimistic in some aspect ,like underwriting strength or rate stickiness, the valuation cushion was large enough to absorb the error. In many of these cases, the market has caught up to the value, and in some, like NLB or Otto, the results have been nothing short of spectacular.
Then there’s maybe one elephant in the room I haven’t addressed yet: the average total return of 25% and the average CAGR of 28%. The latter number, in particular, is skewed by a few recent ideas like Kistos and Otto Energy that delivered outsized returns in a very short period. Even though I used more conservative CAGR estimates for both than their actual performance would suggest, their speed and scale still distort the average. Most of the older ideas have far more tempered, normalized CAGRs. So while I’m proud of that 28%, I recognize it’s an inflated figure unlikely to repeat at the same pace going forward.
The average return, on the other hand, is a bit harder to interpret, since it’s not time-weighted. Still, I’m glad it’s positive — that means that, on average, if you had blindly followed my pitches (which you absolutely shouldn’t do, this is not investment advice), you’d likely have come out ahead.
Thanks for reading. I hope this retrospective helps others reflect on how investment theses evolve over time. For me, the process of tracking and scoring each pitch has been immensely valuable, and I still believe many of these ideas have room to run.
One other distortion in the table is that I have kept the CAGR at a max of 150%, because some ideas, have run up a decent amount in a short term, which leads to CAGR’s so high it completely distorts the table.
Overview of the special event that I added to the final price to get the event adjusted price.

The kind of honest review you fail to see 90% of times with other financial bloggers.
Keep up the spirit.
The transparency on your behalf is about as rare in this industry as a 100 bagger. Hats off to you.